How is your hospital coping? AMA campaign launches 'hospital logjam finder'
The AMA’s ‘Clear the hospital logjam’ campaign has today deployed a ‘hospital logjam finder’ which invites voters to discover how their local hospitals are coping. They are then prompted to email their MPs, seeking a commitment to act for more funding to help our hospitals, if elected.
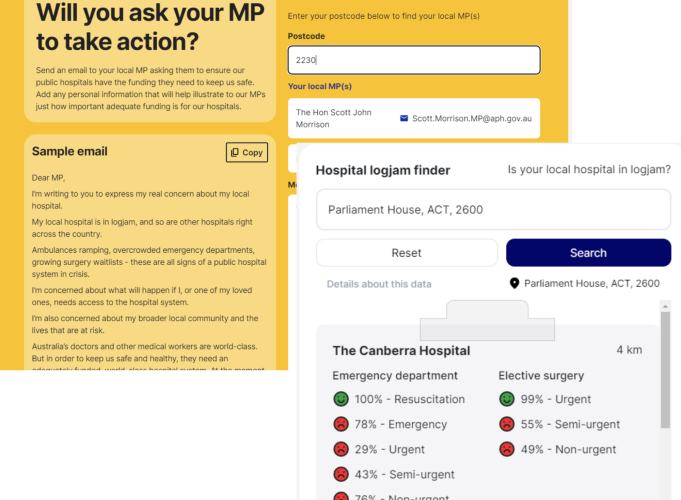
Using the latest hospital data from the Australian Institute of Health and Welfare (AIHW), the logjam finder ranks hospital performance on Emergency Department (ED) response times and whether essential (elective) surgery was carried out in the recommended timeframe.
Voters enter their postcode into the logjam finder and see their local hospitals rated with a traffic light system, indicating the percentage of patients which received care within the clinically recommended time.
If 95 per cent of patients received care within the clinically recommended time, a green smiley face appears. An amber grimace indicates between 85 and 94 per cent of patients received care on time, or their performance was unknown. A red sad face means less than 84 per cent of patients received care within the clinically recommended time.
With data from 201 of Australia’s public hospitals, the logjam finder shows only 15 hospitals received a green light against all eight categories measured and 54 received five or more red lights against the possible eight indicators.
The logjam finder also shows that hospitals in Tasmania are most under pressure, with four major hospitals having six or more red lights.
SA has seven major hospitals with five or more red lights, while WA has six hospitals with five or more red lights even in a year with no substantial COVID outbreak.
Despite the challenges of the pandemic, none of NSW’s 72 hospitals examined had six or more red lights. However, 12 had five red lights, indicating the hospital system as a whole remains under pressure.
Vic has two hospitals with six or more red lights and 15 with five red lights, indicating greater signs of systemic pressure.
Of Queensland’s 26 hospitals examined, four major hospitals had six or more red lights.
Four of NT’s hospitals have six or more red lights, with both Darwin hospitals examined receiving three red lights for elective surgery. The ACT’s two hospitals received five and six red lights.
AMA president, Dr Omar Khorshid, said the hospital logjam finder was a powerful way for people to learn the truth about their local hospitals’ resourcing shortfalls and illustrates how widespread the problems in our public health system are, across the country.
“Our public hospitals should really have received all green lights, because we are talking about the clinically recommended timeframe – what the medical profession says is required to deliver the best outcomes for patients, and there are some hospitals achieving this, but 15 out of 201 is far too few,” Dr Khorshid said.
“I think Australians will be shocked when they use the logjam finder and see the pressure their local hospitals are under. They are justified in asking their MP: ‘is this what we have to accept for our hospitals?’ And, of course, the answer is no.
“We’re asking voters to tell their MP it’s not good enough and they need to act to fix the hospital funding crisis, so our hospitals are future-proofed for the care and world-class performance Australians expect.
“It’s truly a damning indictment that governments have allowed the cycles of crisis in our hospitals to endure for so long.
“All governments need to act. We’re asking the federal government to increase its share of hospital funding from 45 to 50 per cent, and to remove the annual cap on activity. For their part, the states and territories need to commit to improve hospital performance by re-investing that extra five per cent. And both need to fund additional ongoing performance improvement, capacity expansion, and ways to reduce avoidable admissions.
“The AMA’s Clear the hospital logjam campaign sets out a comprehensive solution to fixing the decades-long underfunding problem in our hospital system. We want to make this federal election the one where the incoming government has committed to funding our hospitals for the future.
“The steady flow of logjam stories our campaign is receiving are passionate and heart breaking and show that Australians expect a better hospital experience than they are getting,” Dr Khorshid said. (Ends.)
NOTES:
The hospital logjam finder uses the latest AIHW data on two performance categories for all hospitals in assessing performance:
1) Emergency department performance: the percentage of patients who commenced treatment within the recommended time for each urgency category:
- Resuscitation (Triage Category 1): requires treatment immediately
- Emergency (Triage Category 2): requires treatment within 10 minutes
- Urgent (Triage Category 3): requires treatment within 30 minutes
- Semi-urgent (Triage Category 4): requires treatment within 1 hour
- Non-urgent (Triage Category 5): requires treatment within 2 hours
2) Elective surgery: the percentage of patients who received their surgery within the clinically recommended time for each urgency category:
- Urgent (Category 1): Needing treatment within 30 days.
- Semi-urgent (Category 2): Needing treatment within 90 days.
- Non-urgent (Category 3): Needing treatment within 365 days.
Hospitals were given a ‘traffic light’ rating for each performance metric as a way of highlighting the lack of capacity in the hospital system, and the need for a new funding agreement which helps our hospitals meet future demand.


