2024 Public hospital report card - mental health
edition
State by state public hospital performance - South Australia
Mental health capacity in public hospitals
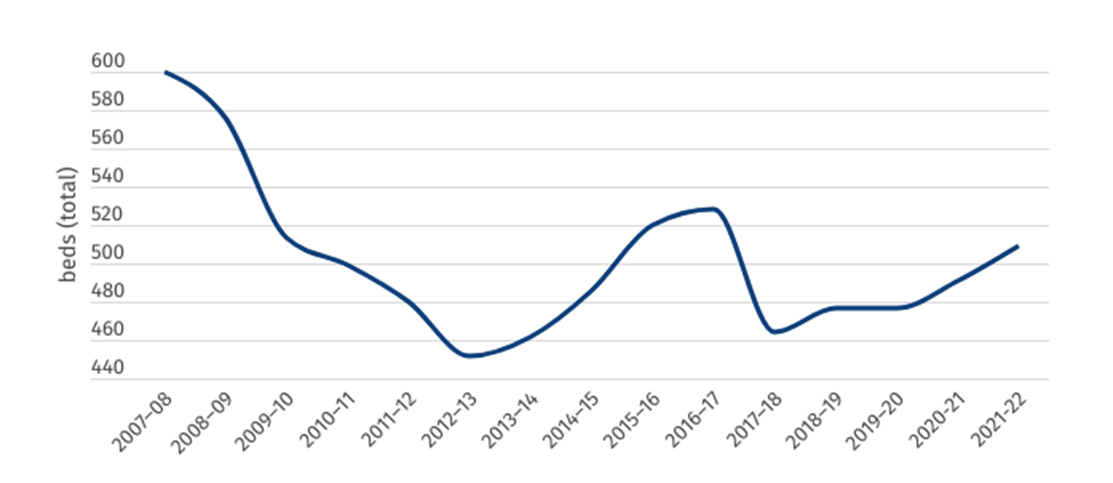
After a long-term downward trend in mental health capacity, South Australia’s public hospitals have been slowly increasing the number of specialised mental health beds since 2017–18, with 45 extra beds being added established between 2017–18 and 2021–22.
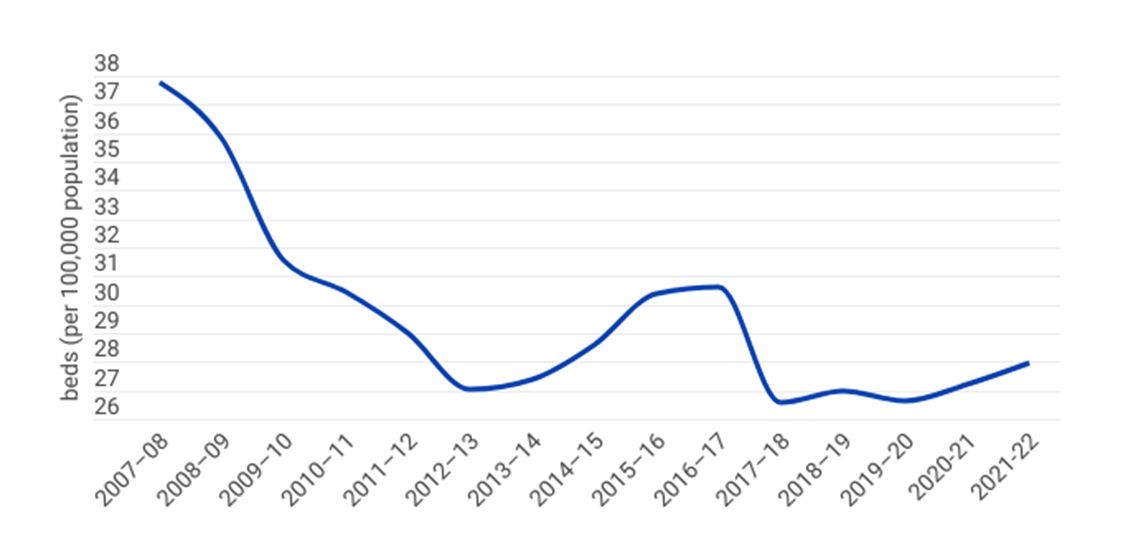
South Australia currently has 27.9 specialised mental health public hospital best per 100,000 citizens, which is slightly higher than the national average.
Figure 1: Total number of specialised mental health public hospital beds (SA)
Figure 2: Specialised mental health public hospital beds per 100,000 population (SA)
Mental health presentations to ED
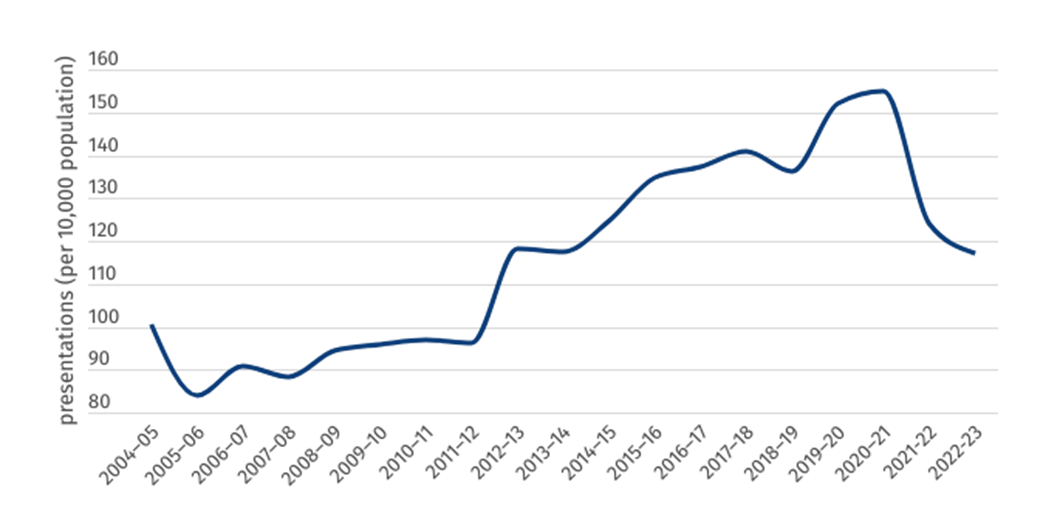
South Australia’s per-person rate of mental health related ED presentations fell for the third year in a row in 2022–23 to 117 presentations per 10,000 people. While this represents the lowest figure in the past 10 years, it remains higher than the national average, demonstrating a continued unmet need for community mental health services in the state.
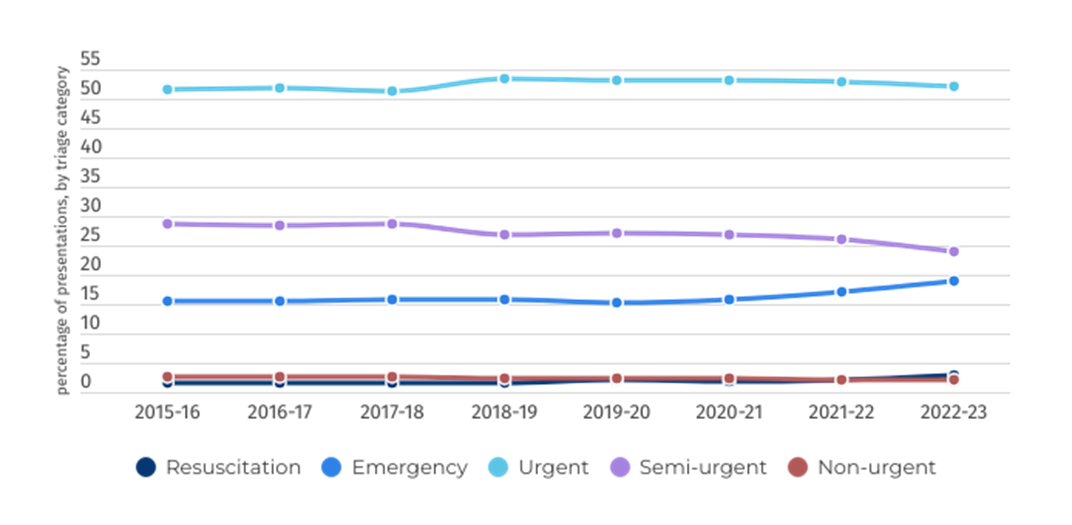
The share of patients triaged for each category remained relatively stable for South Australia in 2022–23.
Figure 3: Rate of ED mental health presentations per 10,000 population
Figure 4: Mental health-related ED presentations, by triage category, per cent
Length of stay
This page demonstrates the length of stay for mental health patients across two areas of the public hospital — the emergency department and inpatient beds once admitted to hospital.
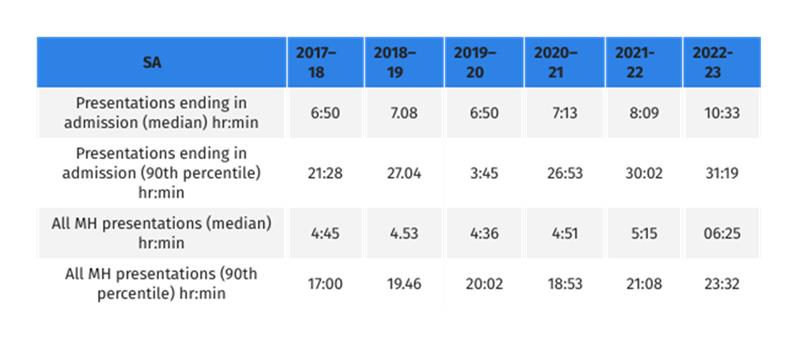
Mirroring national trends, South Australia has seen a worrying and consistent increase in the median time spent in emergency departments. Patients who are eventually admitted to hospital are spending, on average, 10 hours in emergency departments before they receive a hospital bed. Ten per cent of patients now wait more than 31 hours, almost a day and a half, in an overcrowded and stressful ED due to under capacity and poorly resourced hospitals.
These are extremely concerning figures and point to the urgent need for increased capacity to address bed block within South Australia’s public hospitals.
Figure 5: Length of Stay in ED (SA)
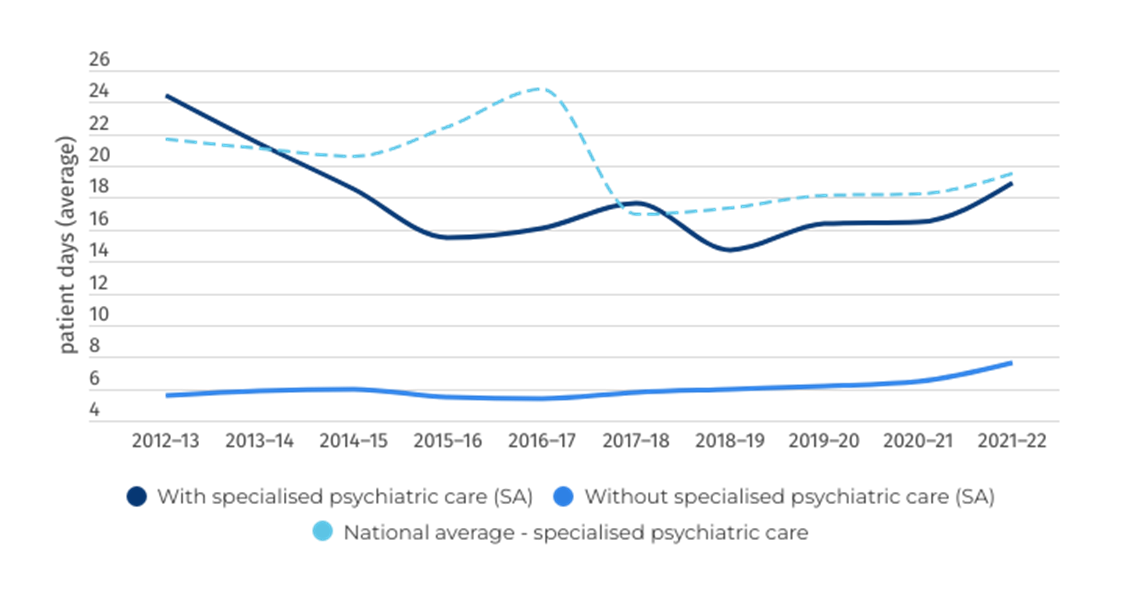
Figure 6: Overnight admitted care length of stay (days) (SA)
Clinical outcomes
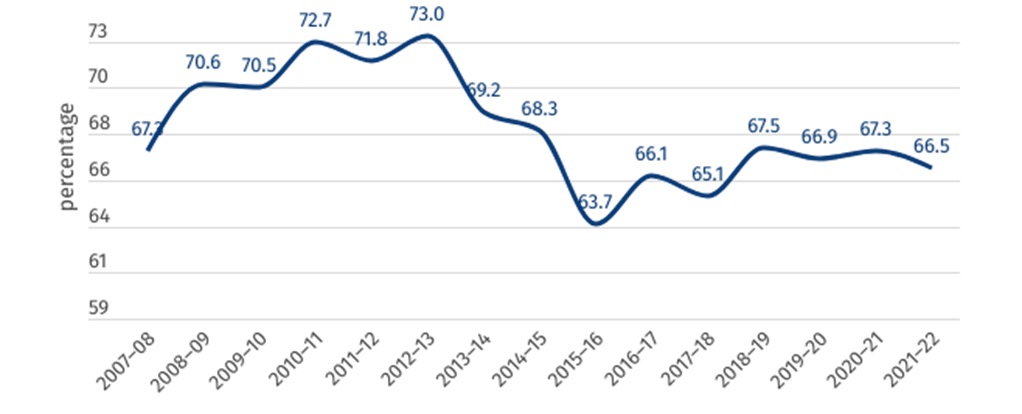
Figure 7 shows the percentage of mental health inpatients who saw a significant improvement to their clinical outcome according to the National Outcomes and Casemix Collection (NOCC). While these figures should not be compared across jurisdictions, 66.5 per cent of mental health-related public hospital inpatients surveyed saw a significant improvement as a result of their treatment in 2021–22 across South Australia.
Figure 7: Clinical outcome of people receiving mental healthcare in hospital (percentage who saw a significant improvement) (SA)
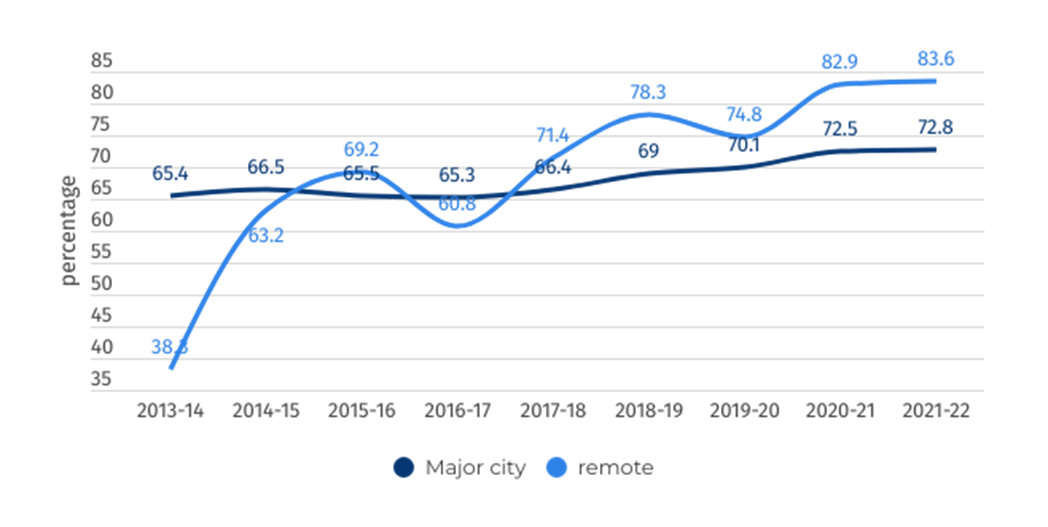
Community follow-up
Community follow-up after psychiatric admission/hospitalisation is defined as the proportion of state and territory governments’ specialised public admitted patient overnight acute separations from psychiatric units for which a community-based ambulatory contact was recorded in the seven days following separation.
Figure 8: Rate of community follow-up within 7 days of discharge from a psychiatric admission