2024 Public hospital report card - mental health
edition
State by state public hospital performance - Queensland
Mental health capacity in public hospitals
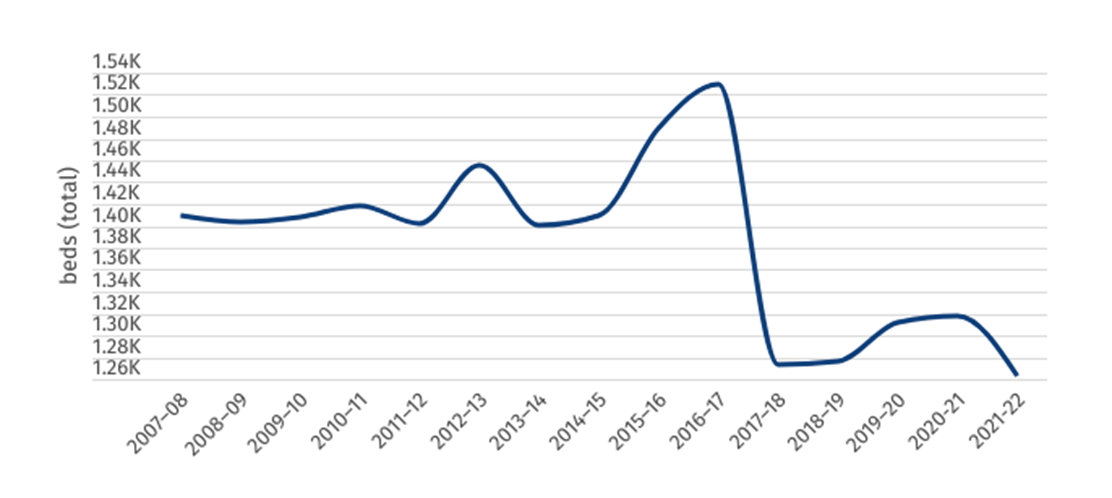
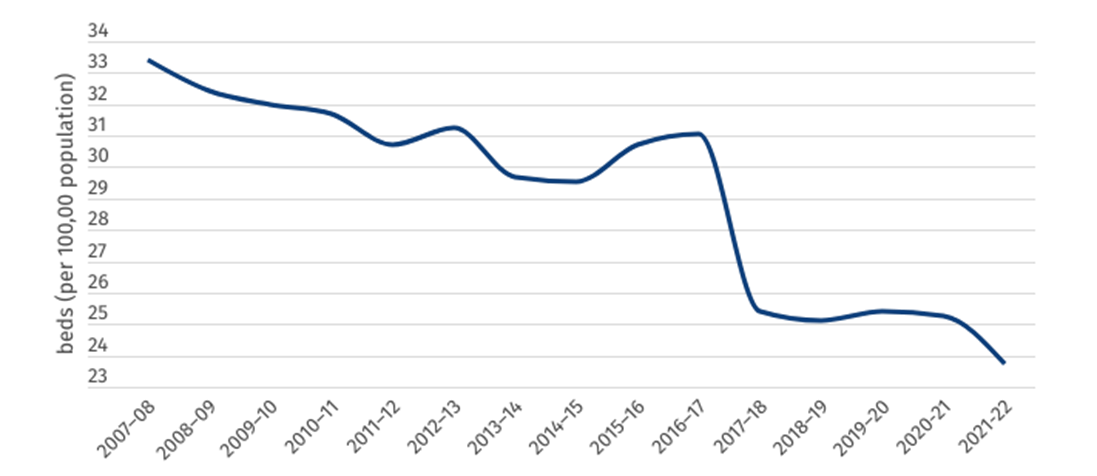
Queensland’s capacity to care for acute mental health patients through their public hospitals has seen a major decline over the past five years. The total number of specialised psychiatric beds in the public hospital system has fallen by 139 in 10 years (from 1402 in 2011–12 to 1263 in 2021–22). When accounting for population growth, the per-person capacity has fallen even further, from 30.7 beds per 100,000 Queenslanders in 2011–12 to 23.7 beds in 2021. This means the per-person mental health capacity of Queensland’s public hospital system has fallen by almost a quarter (23.5 per cent) in the past decade.
Figure 1: Total number of specialised mental health public hospital beds
Figure 2: Specialised mental health public hospital beds per 100,000 population
Mental health presentations to ED
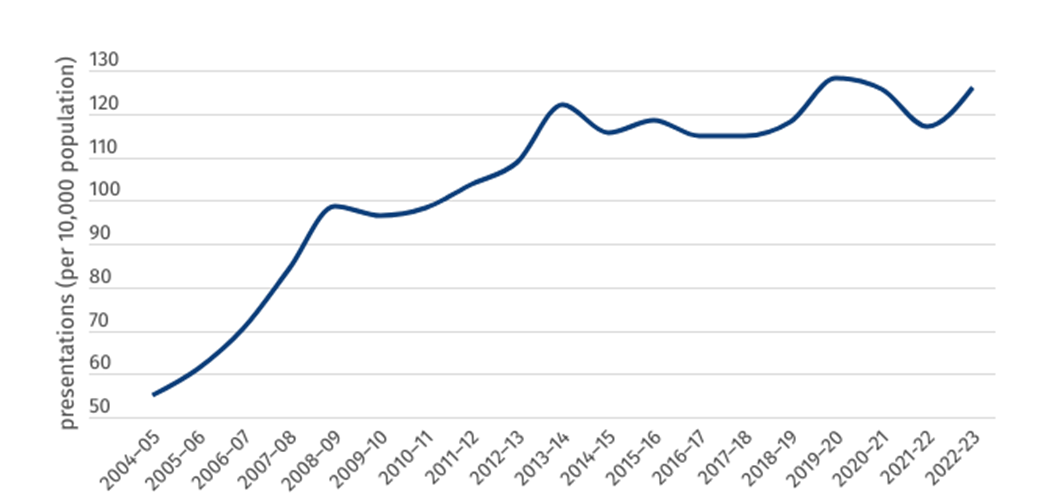
The number of per-population mental health presentations rose in 2022–23, from 117 per 10,000 to 126 per 10,000 in Queensland. This is the second highest rate in all Australian jurisdictions, potentially demonstrating a lack of community services as those suffering from ill mental health are forced to present at the ED as a last resort.
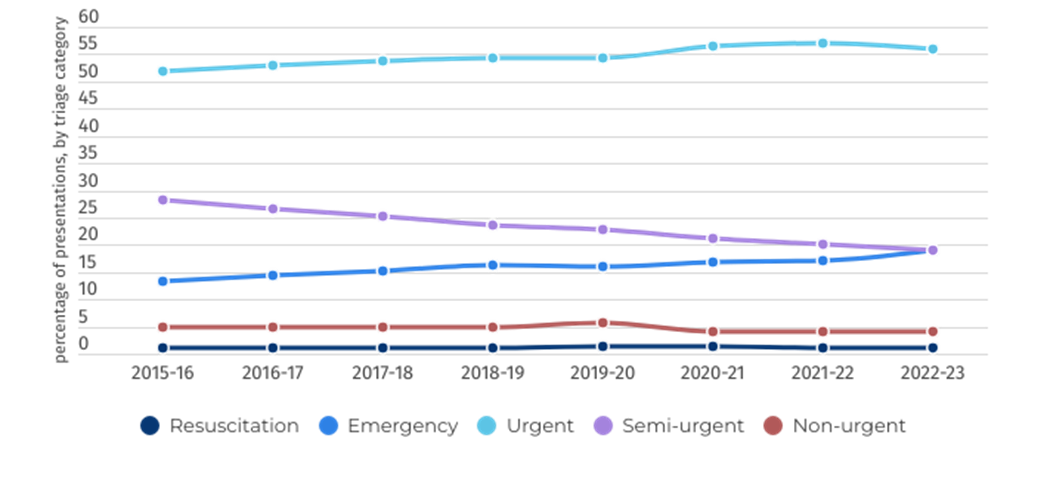
As shown in figure 4, the most frequent triage category for patients presenting to hospital with a mental health condition remains triage category 3, “urgent”, meaning the patient should be seen within 30 minutes. Following national trends, the fasted growing triage category is “emergency”, reflecting the rising prevalence of severe mental health problems within the community.
Figure 3: Rate of ED mental health presentations per 10,000 population
Figure 4: Mental health-related ED presentations, by triage category, per cent
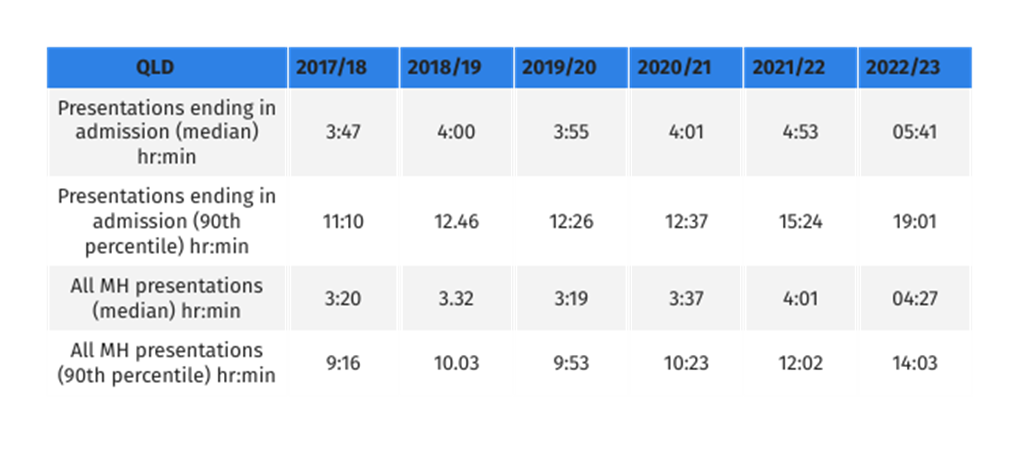
Length of Stay
This page demonstrates the length of stay for mental health patients across two areas of the public hospital — the emergency department and inpatient beds once admitted to hospital.
Mirroring national trends, Queensland has seen a worrying and consistent increase in the median time spent in emergency departments. Patients who are eventually admitted to hospital are spending, on average, over two hours longer in emergency departments than they were just five years prior. Ten per cent of patients now wait 19 hours in an overcrowded and stressful ED due to overcapacity and under resourced hospitals.
Figure 6 shows that the average length of stay for admitted overnight mental health patients receiving specialised psychiatric care is below the national average, at 17.92 days in 2021–22.
Figure 5: Length of stay in ED
Figure 6: Overnight admitted care length of stay (days)
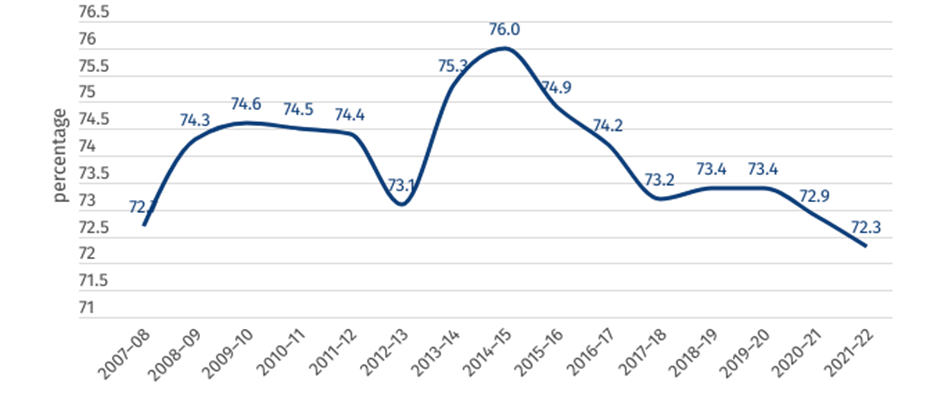
Clinical outcomes
Figure 7 shows the percentage of mental health inpatients who saw a significant improvement to their clinical outcome according to the National Outcomes and Casemix Collection (NOCC). While these figures should not be compared across jurisdictions, 72.3 per cent of mental health related public hospital inpatients surveyed saw a significant improvement as a result of their treatment in 2021–22 across Queensland, the lowest result in the past 15 years.
Figure 7: Clinical outcome of people receiving mental healthcare in hospital (percentage who saw a significant improvement) (QLD)
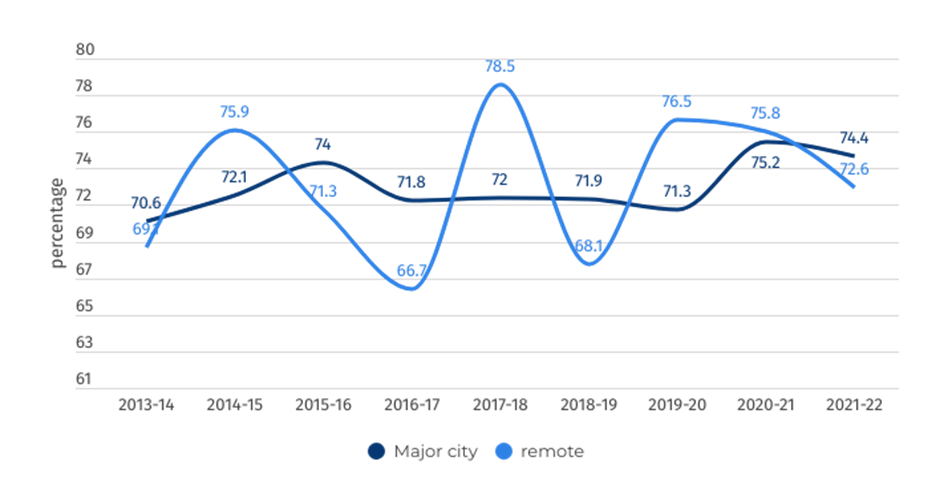
Community follow-up
Community follow-up after psychiatric admission/hospitalisation is defined as the proportion of state and territory governments’ specialised public admitted patient overnight acute separations from psychiatric units for which a community-based ambulatory contact was recorded in the seven days following separation.
Figure 8: Rate of community follow-up within 7 days of discharge from a psychiatric admission (QLD)